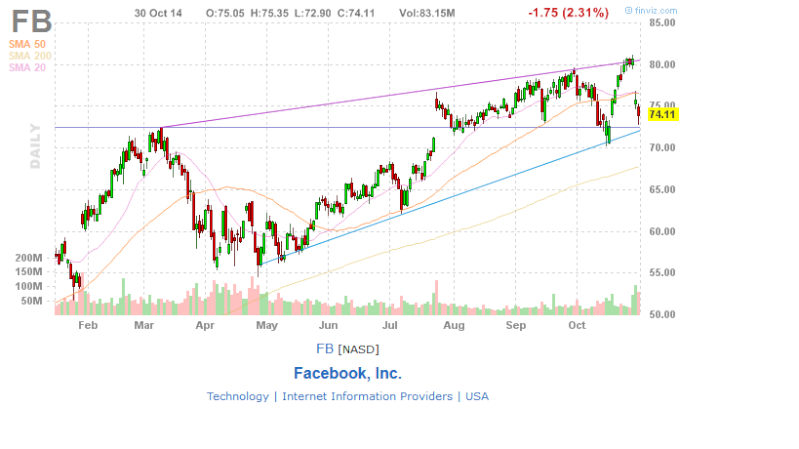
Update técnico:
A empresa encontra-se a lateralizar.

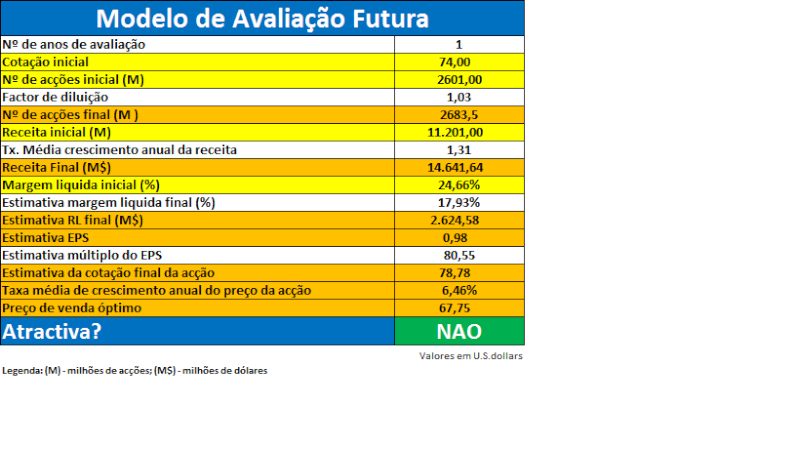
VER ARTIGO COM FIGURAS AQUI .
Facebook Is Undervalued Based On The Company's Growth Outlook
Nov. 13, 2014 7:43 AM ET
Summary
Facebook's growth is extraordinary, in the last quarter revenues are up 59%, user numbers are still growing at a double digit pace.
Facebook's fundamentals look good: High (and growing) margins and returns on capital, no debt.
Facebook's earnings multiple is at an all time low.
The Graham formula suggests that Facebook is trading at a discount to its intrinsic value right now.
The DCF method suggests that Facebook is undervalued if the long term EPS growth rate exceeds 5% annually.
Facebook (NASDAQ:FB) has seen a decline in its stock price after the company released its third quarter results, Facebook now trades seven percent below its 52 week high. This could be a good entry point for investors interested in the social media giant.
Latest results
On October 28, 2014, Facebook reported third quarter results: Revenues were $3.2 billion (up 59% yoy), net income (GAAP) grew 90% to $806 million, net income (non-GAAP) grew 73% to $1149 million. Diluted EPS (non-GAAP) came in at $0.43, up 59% yoy (diluted EPS (GAAP) came in at $0.30, up 76% yoy). This has been another strong quarter for Facebook with almost 60% revenue growth and further profit margin expansion. For the first nine months of 2014 Facebook' revenues are up 62% to $8.6 billion. Third quarter free cash flow was $766 million.
The number of Daily Active Users (DAU) increased by 19% to 864 million in the third quarter, the number of mobile DAUs increased 39% yoy to 703 million. The number of monthly users increased 14% to 1.35 billion (the number of mobile monthly users increased 29% to 1.12 billion). Facebook's user numbers are still growing at a double digit pace, growth is even faster in Facebook's mobile segment.
Since Facebook highly depends on a rising number of users I will start with this chart, depicting the number of Facebook's DAUs over the last nine quarters. Facebook is growing its user base in all four regions of the world, unsurprisingly the growth pace is the lowest in established markets (North America and Europe) and highest in Asia and the Rest of the world. Quarter to quarter Facebook grow by another 35 million daily users, bringing the total number of DAUs to 864 million.
The ratio of DAUs to MAUs (daily to monthly users) is 64% in the third quarter, higher than it has been over the last two years. This ratio is increasing, showing that users are getting more attached to Facebook - an increasing quotient of users chooses to spend time on Facebook's social networks every day.
FB Revenue
Over the last twelve months Facebook's results have shown strong growth: Trailing revenue is $11.2 billion (up 42% yoy), net income grew to $2.76 billion (up 84% yoy) and earnings per share (diluted) grew to $1.05 (up 78% yoy).
FB Profit Margin Chart
Facebook's profit margin is very high (25%) and rapidly increasing. Just over the last twelve months the company managed to expand its margin from 19% to 25%. The result is a net income growth rate that is a lot higher than the company's revenue growth rate. Facebook's returns on capital are great as well, the company's ROCE is 27.4% (and has also increased rapidly over the past). This shows that the company is able to allocate shareholder's capital in a very profitable way.
Facebook does not use any leverage at all (debt/equity ratio of 0.00) and has very high liquidity (current ratio of 13.1). This makes Facebook a rather safe investment with a very low insolvency risk. Facebook holds cash and equivalents amounting to $14.3 billion.
Facebook has high multiples: The company's trailing P/E ratio is 71.8, the trailing EV/EBITDA ratio is 32.4. These multiples are high compared to the market, but they are low compared to Facebook's historic multiples: As you can see in the chart above, Facebook's P/E ratio has been declining considerably over the last twelve months and now is at a 52 week low. We may have a buying opportunity for this high growth company, which has always had higher multiples over its (rather short) company history.
The EPS growth rate estimate for the next five years is 36.4% annually, the PEG ratio thus is 1.98 - not a low valuation, but not a really high valuation either. Facebook's forward P/E ratio is 39.4.
THE ANALIST USE THE GRAHAM FORMULA THAT IS VERY USEFULL:If we use the Graham formula to determine Facebook's fair value, we are led to the following conclusion:
V= EPS*(8.5+2*G)*4.4/Y
wherein
EPS = earnings per share in the last twelve months
G = estimated EPS growth rate over the next 5 years
Y = yield on AAA corporate bonds
If we apply Facebook's numbers, we receive the following intrinsic value:
$1.05*(8.5+2*36.4)*4.4/4.1 = $91.61.
The Graham formula suggests Facebook has upside of 21% to its intrinsic value. Based on the analysts EPS growth consensus for the next five years (which is a lot less than Facebook's current growth rate) Facebook is trading at a discount at today's price.
Discounted cash flow methodAnother, more advanced, method of determining a businesses value is the approach of discounting all future cash flows with a desired return rate and adding these present values.
Additional to the numbers used above, we have to use some more presumptions:
For the first 5 years, we can use the expected growth rate of 36.4% from above, for the time after, I will use multiple scenarios.
We will use a discount factor of 10% (this means our goal for our investment is an average annual return of 10%):
If we assume that the EPS growth rate after year five will be a conservative 5%, the current value is $75.12.
If we assume that the EPS growth rate will level down to an average 6% after year five, we get a fair value of $92.05.
If we assume that the EPS growth rate will level down to 7% annually after year five, we get a fair value of $120.27.
High growth in the next couple of years and ongoing growth thereafter will be achieved due to a number of reasons:
- Growing number of Facebook users, with just 240M users in Asia Facebook has still a lot of room to grow.
- Facebook's users are becoming more active, the ratio of daily users to monthly users is increasing - this means that more ad revenue per user will be generated (as the time spent on Facebook's social networks increases).
- Facebook's margins are expanding considerably, the company's bottom line will grow at a faster pace than its top line (e.g. in the last quarter revenue increased by 59% and net income increased by 90%).
- Facebook's acquisitions (WhatsApp, Instagram, Oculus) will start contributing to the company's bottom line in the future.
The DCF method leads to the following conclusion: Facebook is fairly valued if the company's long term EPS growth rate is 5%, it is undervalued if the company manages to grow at a faster pace. Based on Facebook's high growth potential I think an EPS growth rate of 5% is very conservative. A higher growth rate seems more appropriate - Facebook is undervalued right now.
Bottom line
Facebook is a company with an extraordinary growth pace and great fundamentals (high and expanding margins and returns on capital, high liquidity, low debt). Although Facebook's multiples are not low, they are lower than they have been since the company went public, providing a buying opportunity right now.
Based on its future growth rate Facebook is trading at a discount to its intrinsic value, based on the Graham formula and the DCF method (assuming a long term growth rate of more than 5%).
With its high growth pace Facebook is a compelling investment at today's price, 7% below its 52 week high and with its P/E ratio at an all time low.
 Início